Note
Go to the end to download the full example code.
Fringes transform
An example of transform on a dataset containing fringes.
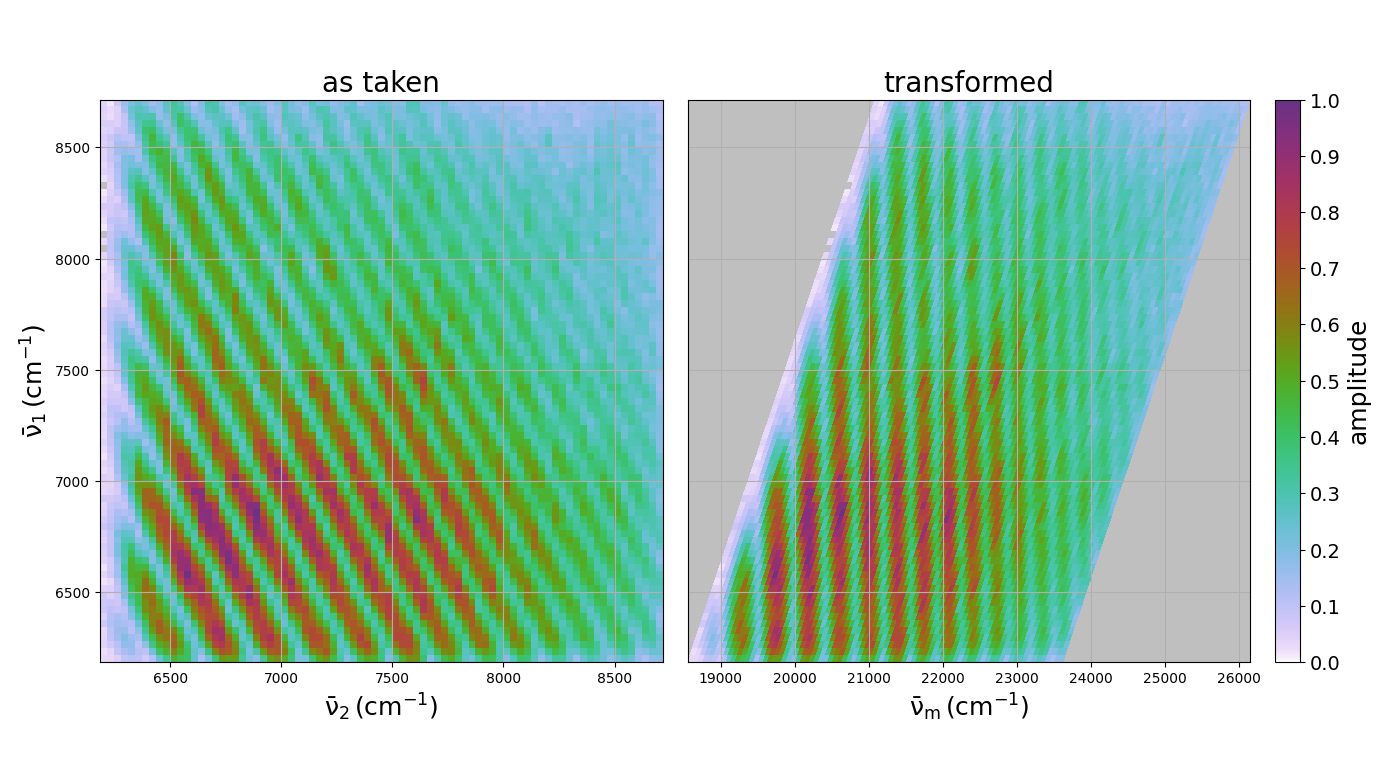
/home/docs/checkouts/readthedocs.org/user_builds/wrighttools/envs/stable/lib/python3.12/site-packages/numpy/_core/numeric.py:2376: RuntimeWarning: One of rtol or atol is not valid, atol: inf, rtol: 0
  res = all(isclose(a, b, rtol=rtol, atol=atol, equal_nan=equal_nan))
Correction factor applied to d1
Correction factor applied to d2
data created at /tmp/qtb4h1n0.wt5::/
  axes: ('w2', 'w1')
  shape: (81, 81)
axis w2 converted from wn to wn
axis w1 converted from wn to wn
axis wm converted from nm to wn
axis w1 converted from wn to wn

<matplotlib.colorbar.Colorbar object at 0x7aca042ba5d0>
import matplotlib.pyplot as plt

import WrightTools as wt
from WrightTools import datasets

p = datasets.PyCMDS.w2_w1_000
data = wt.data.from_PyCMDS(p)

data.signal_mean.symmetric_root(2)  # to amplitude level
data.convert("wn")

fig, gs = wt.artists.create_figure(width="double", cols=[1, 1, "cbar"])

# as taken
ax = plt.subplot(gs[0, 0])
ax.pcolor(data)
wt.artists.set_ax_labels(xlabel=data.w2.label, ylabel=data.w1.label)
ax.grid()
ax.set_title("as taken", fontsize=20)

# transformed
ax = plt.subplot(gs[0, 1])
data.transform("wm", "w1")
data.convert("wn")
ax.pcolor(data)
wt.artists.set_ax_labels(xlabel=data.wm.label, yticks=False)
ax.grid()
ax.set_title("transformed", fontsize=20)

# colorbar
cax = plt.subplot(gs[0, -1])
wt.artists.plot_colorbar(cax, label="amplitude")
Total running time of the script: (0 minutes 0.531 seconds)