Note
Click here to download the full example code
Heal
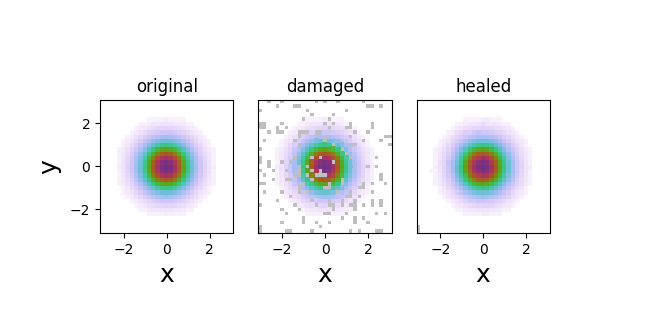
An example of how heal works.

Out:
channel /healed healed in 0.024 seconds
import numpy as np
from matplotlib import pyplot as plt
import WrightTools as wt

# create original arrays
x = np.linspace(-3, 3, 31)[:, None]
y = np.linspace(-3, 3, 31)[None, :]
arr = np.exp(-1 * (x**2 + y**2))
# create damaged array
arr2 = arr.copy()
np.random.seed(11)  # set seed for reproducibility
arr2[np.random.random(arr2.shape) < 0.2] = np.nan
# create data object
d = wt.data.Data()
d.create_variable("x", values=x)
d.create_variable("y", values=y)
d.create_channel("original", arr)
d.create_channel("damaged", arr2)
d.create_channel("healed", arr2)
d.transform("x", "y")
# heal
d.heal(channel="healed")
# create figure
fig, gs = wt.artists.create_figure(cols=[1, 1, 1])
for i in range(3):
    ax = plt.subplot(gs[i])
    ax.pcolor(d, channel=i)
    ax.set_title(d.channel_names[i])
ticks = [-2, 0, 2]
wt.artists.set_fig_labels(
    xlabel=d.axes[0].label, ylabel=d.axes[1].label, xticks=ticks, yticks=ticks
)
Total running time of the script: ( 0 minutes 0.358 seconds)