Note
Go to the end to download the full example code.
Colormaps
Different colormaps.
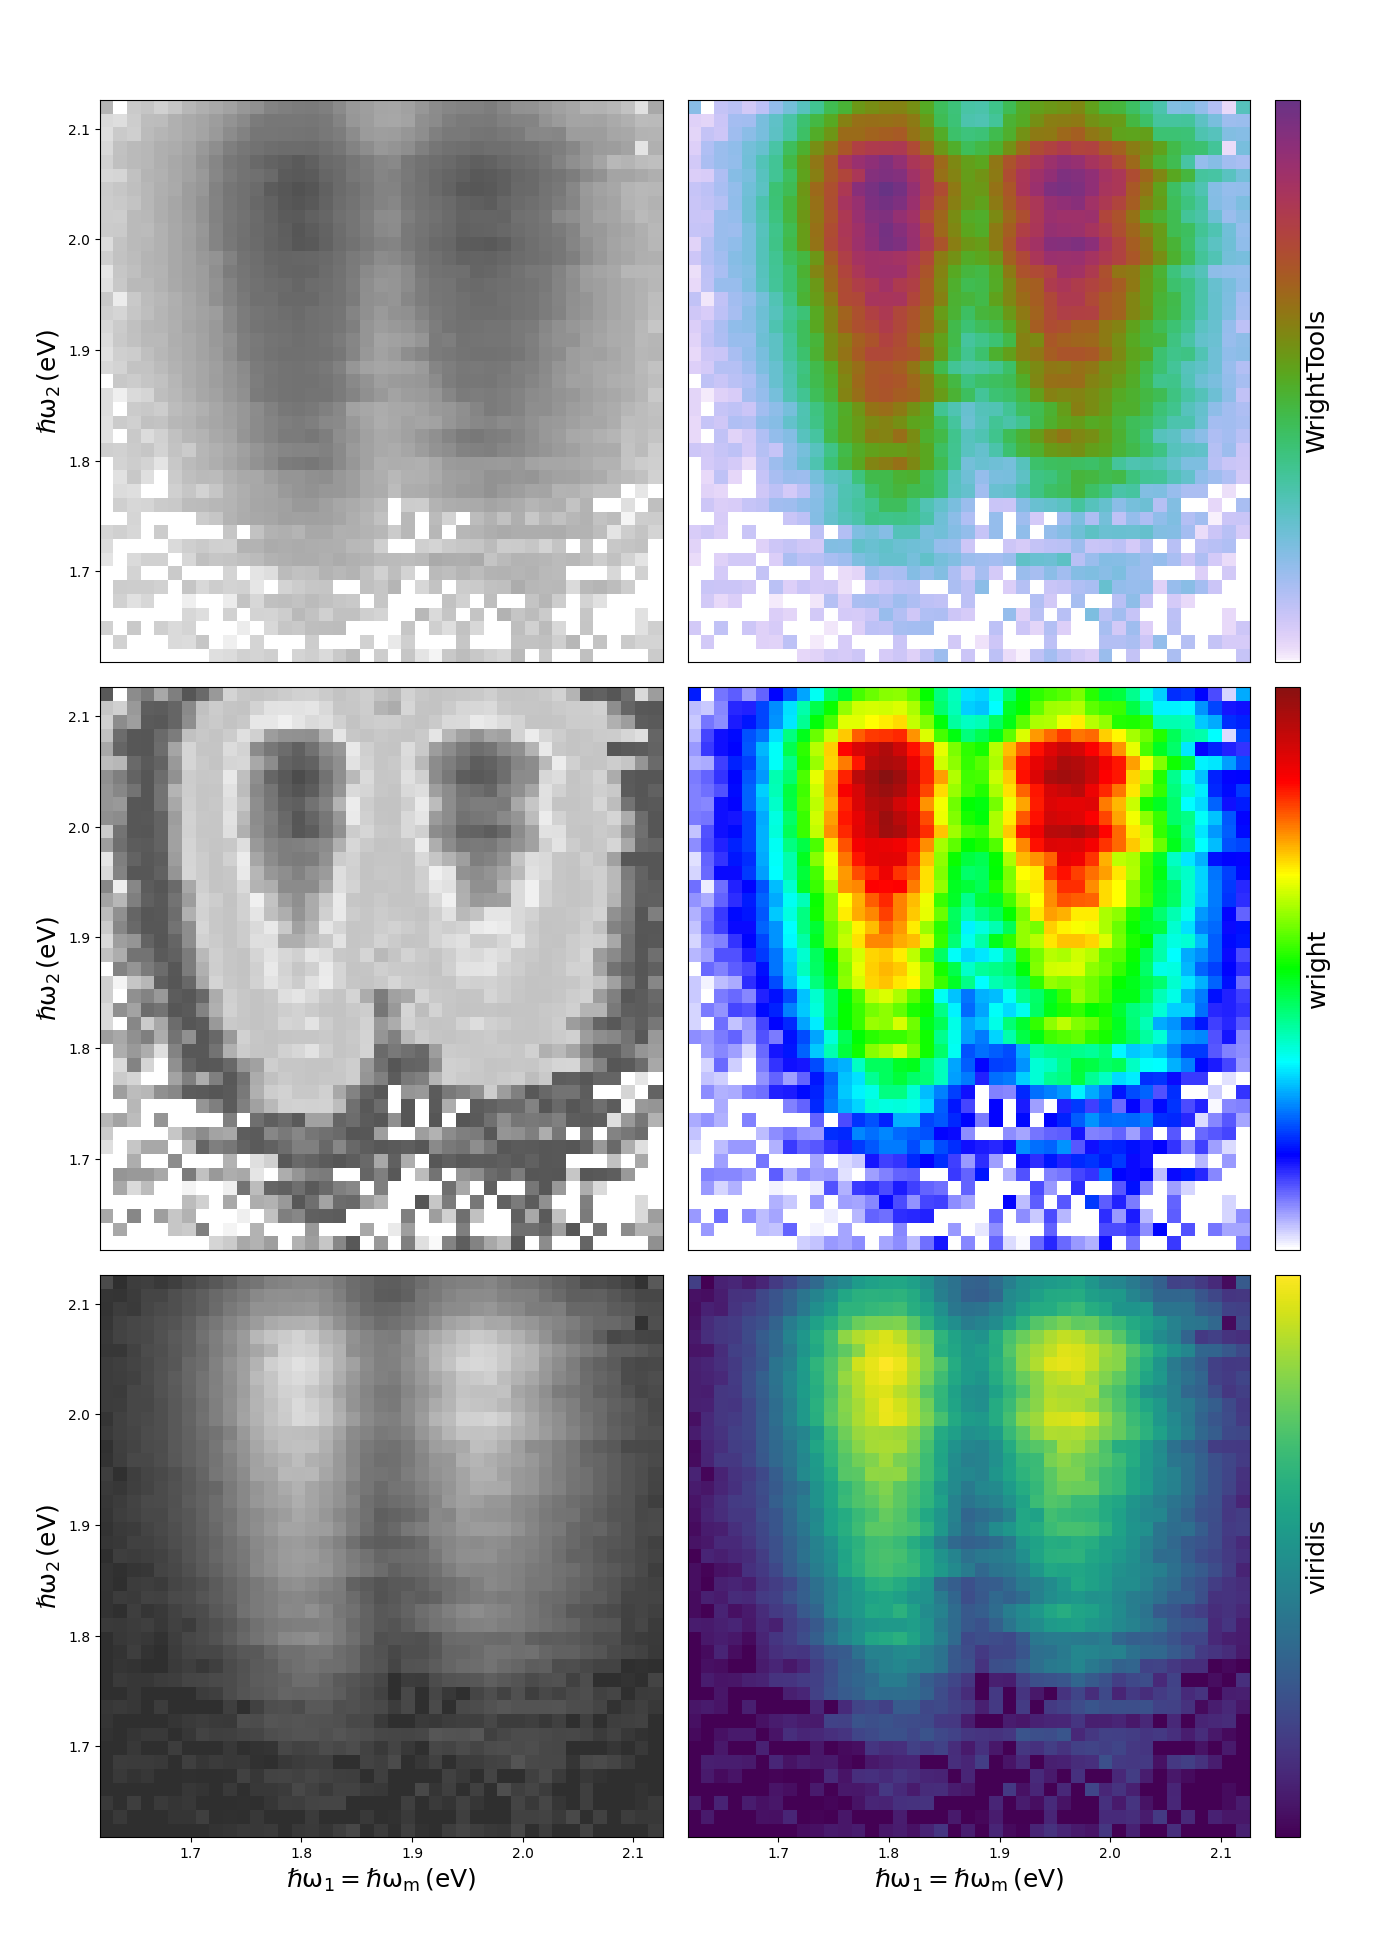
channel ai0 leveled along axis 2
axis w2 converted from nm to eV
axis w1=wm converted from nm to eV
chopped data into 1 piece(s) in ('w1=wm', 'w2')
import matplotlib.pyplot as plt
from matplotlib import cm

import WrightTools as wt
from WrightTools import datasets

fig, gs = wt.artists.create_figure(width="double", cols=[1, 1, "cbar"], nrows=3)

p = datasets.wt5.v1p0p1_MoS2_TrEE_movie
data = wt.open(p)
data.level(0, 2, -3)
data.convert("eV")
data.ai0.symmetric_root(2)
data = data.chop("w1=wm", "w2", at={"d2": [-600, "fs"]})[0]
data.ai0.normalize()
data.ai0.clip(min=0, replace="value")


def fill_row(row, cmap):
    # greyscale
    ax = plt.subplot(gs[row, 0])
    ax.pcolor(data, cmap=wt.artists.grayify_cmap(cmap))
    # color
    ax = plt.subplot(gs[row, 1])
    ax.pcolor(data, cmap=cmap)
    # cbar
    cax = plt.subplot(gs[row, 2])
    wt.artists.plot_colorbar(cax=cax, label=cmap.name, cmap=cmap)
    wt.artists.set_ax_labels(cax, yticks=False)


cmap = wt.artists.colormaps["default"]
fill_row(0, cmap)
cmap = wt.artists.colormaps["wright"]
fill_row(1, cmap)
cmap = cm.viridis
fill_row(2, cmap)

# label
wt.artists.set_fig_labels(xlabel=data.w1__e__wm.label, ylabel=data.w2.label, col=slice(0, 1))
Total running time of the script: (0 minutes 0.701 seconds)