Note
Go to the end to download the full example code.
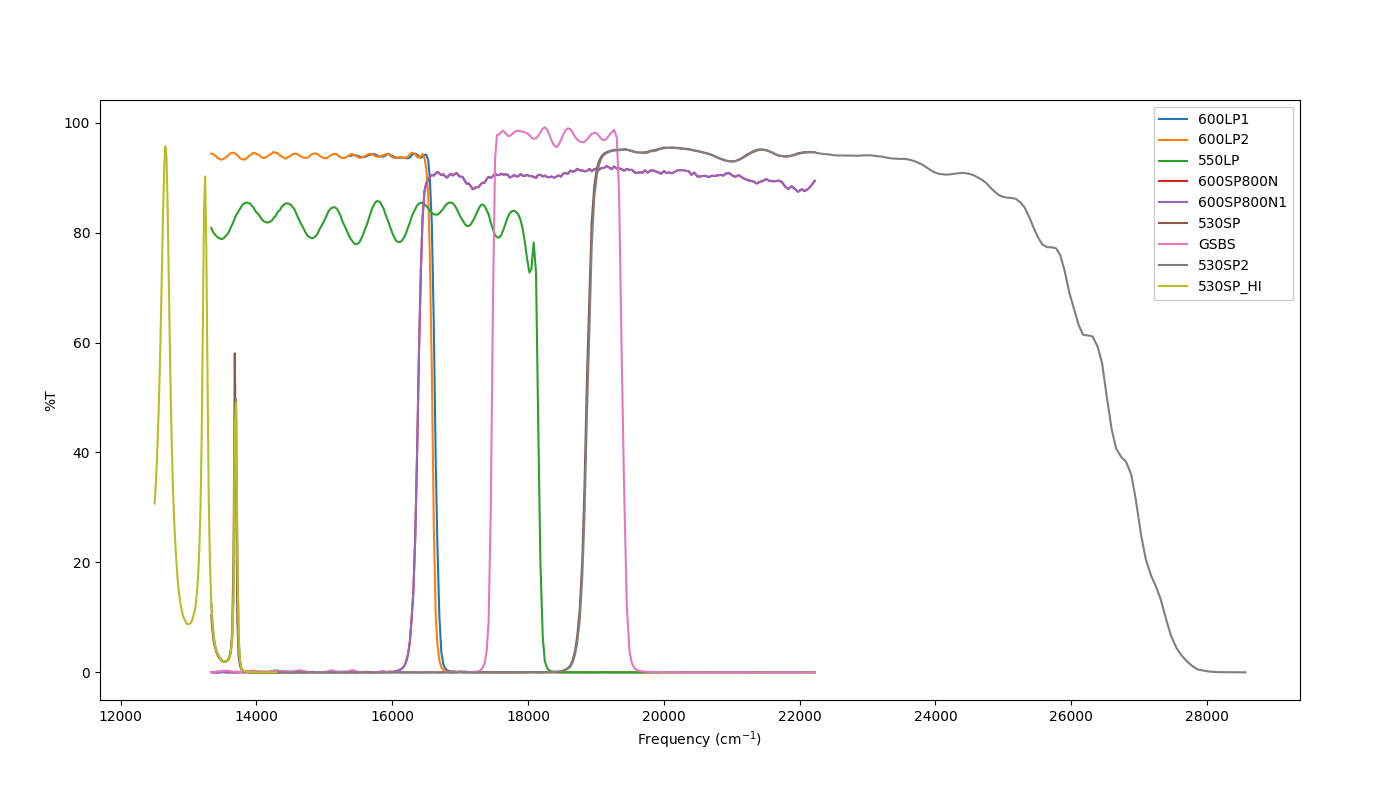
Plotting Multiple Lines
A quick demonstration of how to plot multiple lines on the same
set of axes, using create_figure() to have a set of axes
which can plot data objects directly.
The dataset is a set of optical filters transmission spectra.
11 data objects successfully created from Cary file:
  0: 600LP
  1: 600LP1
  2: 600LP2
  3: 550LP
  4: 600SP800N
  5: 600SP800N1
  6: 530SP
  7: GSBS
  8: 550LP2
  9: 530SP2
  10: 530SP_HI

<matplotlib.legend.Legend object at 0x7656cce71040>
import WrightTools as wt
from WrightTools import datasets
from matplotlib import pyplot as plt

p = datasets.Cary.filters
col = wt.collection.from_Cary(p)

fig, gs = wt.artists.create_figure(width="double", default_aspect=0.5)
ax = plt.subplot(gs[0])

for data in col.values():
    if data.natural_name in ("600LP", "550LP2"):
        continue
    data.convert("wn", verbose=False)
    ax.plot(data, label=data.natural_name)


ax.set_ylabel("%T")
ax.set_xlabel("Frequency (cm$^{-1}$)")
ax.legend()
Total running time of the script: (0 minutes 0.261 seconds)