Note
Go to the end to download the full example code.
Tune test
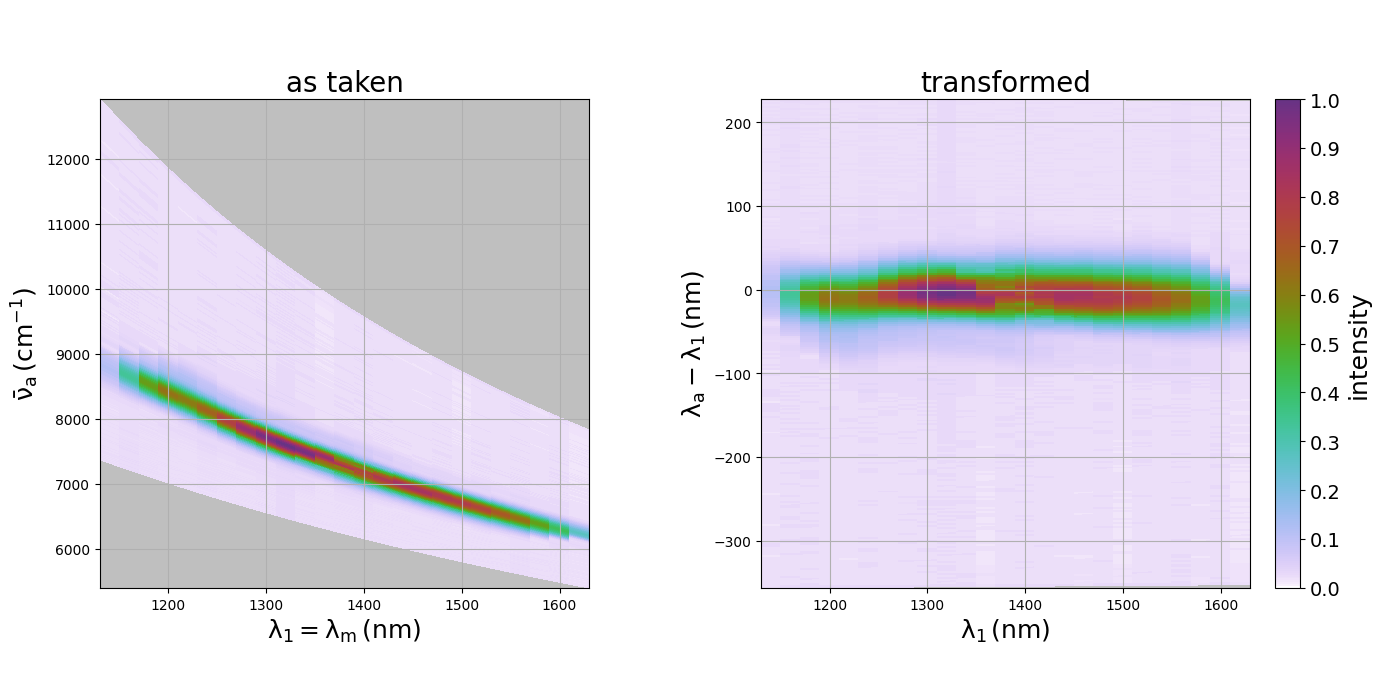
An example of transform on a tune test.
/home/docs/checkouts/readthedocs.org/user_builds/wrighttools/envs/latest/lib/python3.12/site-packages/numpy/_core/numeric.py:2311: RuntimeWarning: One of rtol or atol is not valid, atol: inf, rtol: 0
  res = all(isclose(a, b, rtol=rtol, atol=atol, equal_nan=equal_nan))
Correction factor applied to d1
Correction factor applied to d2
data created at /tmp/vvyr9863.wt5::/
  axes: ('w1__e__wm', 'wa')
  shape: (25, 256)
/home/docs/checkouts/readthedocs.org/user_builds/wrighttools/envs/latest/lib/python3.12/site-packages/WrightTools/artists/_base.py:392: UserWarning: The input coordinates to pcolor are interpreted as cell centers, but are not monotonically increasing or decreasing. This may lead to incorrectly calculated cell edges, in which case, please supply explicit cell edges to pcolor.
  return super().pcolor(*args, **kwargs)

<matplotlib.colorbar.Colorbar object at 0x7656bbe17e30>
import matplotlib.pyplot as plt

import WrightTools as wt
from WrightTools import datasets

p = datasets.PyCMDS.w1_wa_000
data = wt.data.from_PyCMDS(p)

fig, gs = wt.artists.create_figure(width="double", cols=[1, 0.25, 1, "cbar"])

# as taken
ax = plt.subplot(gs[0, 0])
ax.pcolor(data)
wt.artists.set_ax_labels(xlabel=data.w1__e__wm.label, ylabel=data.wa.label)
ax.grid()
ax.set_title("as taken", fontsize=20)

# transformed
ax = plt.subplot(gs[0, 2])
data.transform("w1", "wa-w1")
ax.pcolor(data)
wt.artists.set_ax_labels(xlabel=data.w1.label, ylabel=data.wa__m__w1.label)
ax.grid()
ax.set_title("transformed", fontsize=20)

# colorbar
cax = plt.subplot(gs[0, -1])
wt.artists.plot_colorbar(cax, label="intensity")
Total running time of the script: (0 minutes 0.448 seconds)