Note
Click here to download the full example code
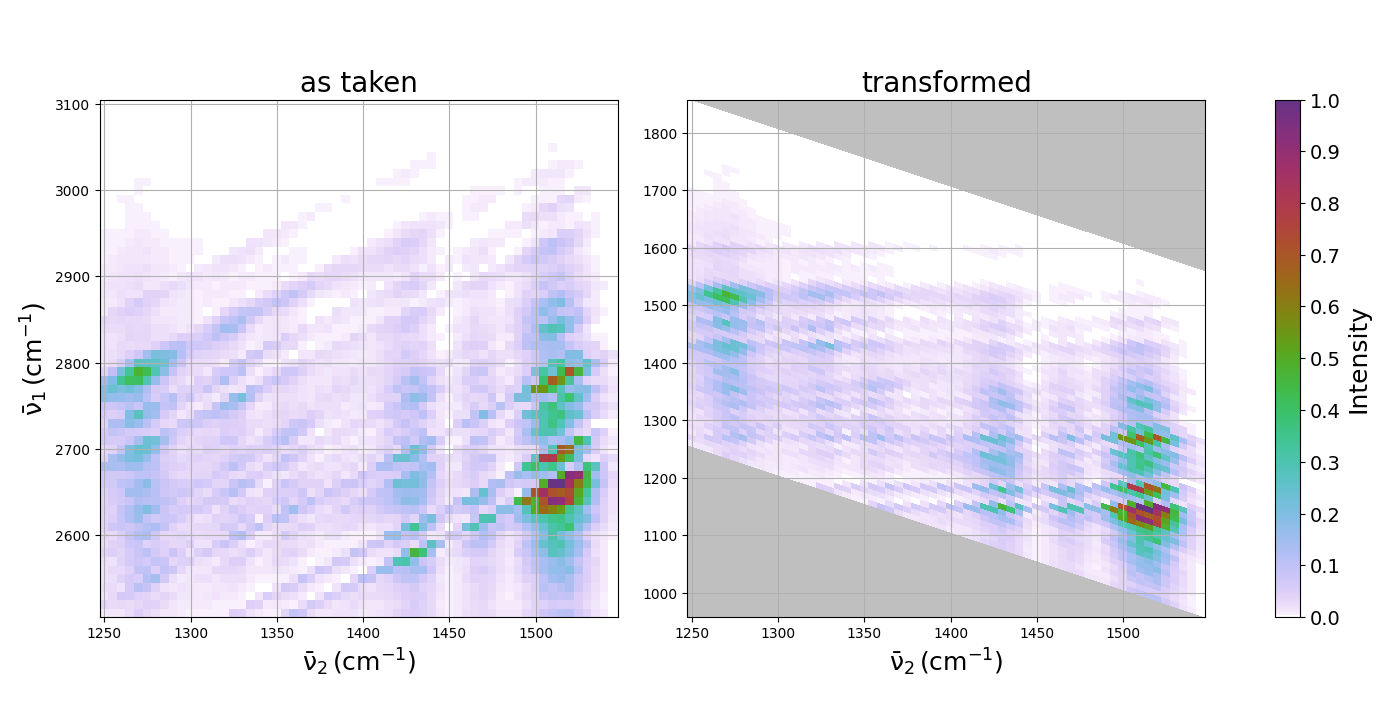
DOVE transform
An example of transform on a dataset from a DOVE experiment.
Out:
<matplotlib.colorbar.Colorbar object at 0x7f7a4b2f9eb0>
import matplotlib.pyplot as plt

import WrightTools as wt
from WrightTools import datasets

p = datasets.KENT.LDS821_DOVE
data = wt.data.from_KENT(p, ignore=["d1", "d2", "wm"], verbose=False)

fig, gs = wt.artists.create_figure(width="double", cols=[1, 1, "cbar"], wspace=0.7)

# as taken
ax = plt.subplot(gs[0, 0])
data.transform("w2", "w1")
ax.pcolor(data)
wt.artists.set_ax_labels(xlabel=data.w2.label, ylabel=data.w1.label)
ax.grid()
ax.set_title("as taken", fontsize=20)

# transformed
ax = plt.subplot(gs[0, 1])
data.transform("w2", "w1-w2")
ax.pcolor(data)
wt.artists.set_ax_labels(xlabel=data.w2.label)
ax.grid()
ax.set_title("transformed", fontsize=20)

# colorbar
cax = plt.subplot(gs[0, -1])
wt.artists.plot_colorbar(cax, label="Intensity")
Total running time of the script: ( 0 minutes 1.028 seconds)