Note
Click here to download the full example code
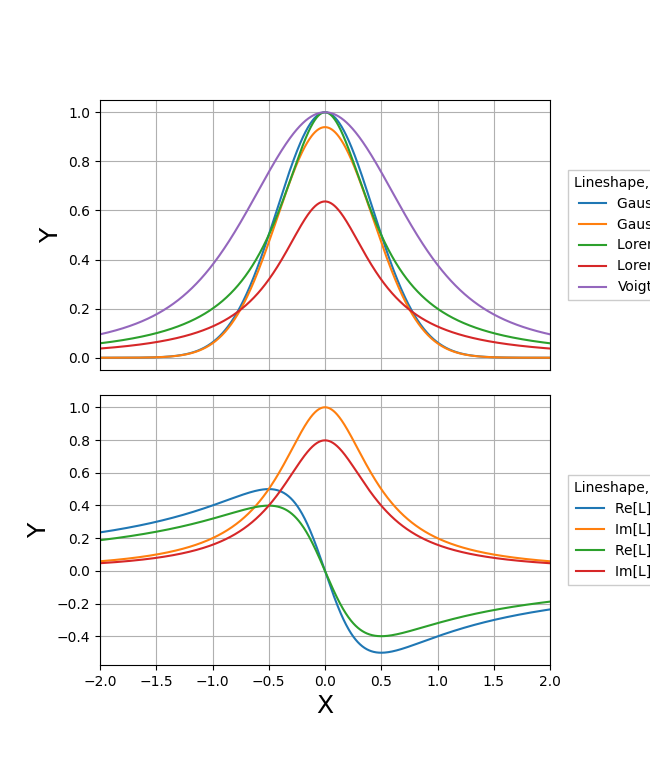
Lineshapes
Common lineshapes included in kit
import matplotlib.pyplot as plt

import WrightTools as wt

import numpy as np


# initiate figure
fig, gs = wt.artists.create_figure(nrows=2, default_aspect=0.6)
axs = [plt.subplot(gs[i]) for i in range(2)]

# initial parameters
x = np.linspace(-2, 2, 1001)
x0 = 0
FWHM = 1
G = 0.5
# plot all of the real versions
ax = axs[0]
y = wt.kit.gaussian(x, x0, FWHM, norm="height")
ax.plot(x, y, label="Gaussian, height")
y = wt.kit.gaussian(x, x0, FWHM, norm="area")
ax.plot(x, y, label="Gaussian, area")
y = wt.kit.lorentzian_real(x, x0, G, norm="height")
ax.plot(x, y, label="Lorentzian, height")
y = wt.kit.lorentzian_real(x, x0, G, norm="area")
ax.plot(x, y, label="Lorentzian, area")
y = wt.kit.voigt(x, x0, FWHM, G)
ax.plot(x, y / y.max(), label="Voigt")
# plot the complex variants
ax = axs[1]
y = wt.kit.lorentzian_complex(x, x0, G, norm="height_imag")
ax.plot(x, y.real, label="Re[L], height_imag")
ax.plot(x, y.imag, label="Im[L], height_imag")
y = wt.kit.lorentzian_complex(x, x0, G, norm="area_int")
ax.plot(x, y.real, label="Re[L], area_int")
ax.plot(x, y.imag, label="Im[L], area_int")
# finish
for ax in axs:
    ax.legend(
        bbox_to_anchor=(1.04, 0.5),
        loc="center left",
        borderaxespad=0,
        title="Lineshape, normalization",
    )
    ax.grid()
    ax.set_xlim(-2, 2)
wt.artists.set_fig_labels(fig, "X", "Y")
Total running time of the script: ( 0 minutes 0.235 seconds)