Note
Click here to download the full example code
Join
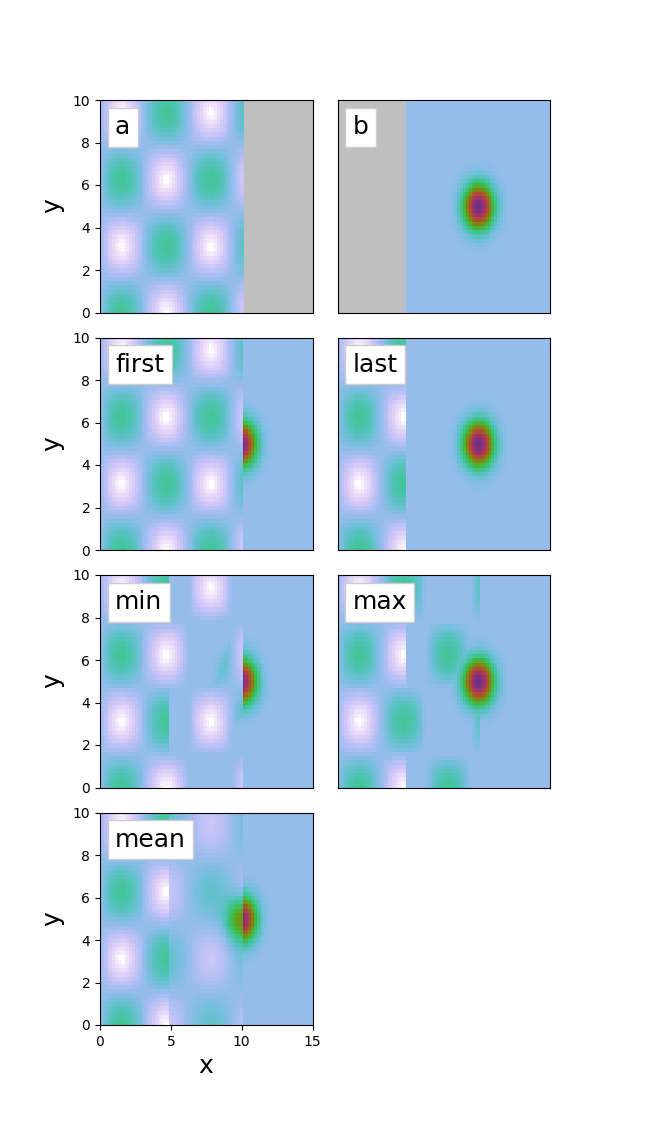
Some examples of how joining works.
Out:
2 datas joined to create new data:
  axes:
    x : 76 points from 0.0 to 15.0 None
    y : 51 points from 0.0 to 10.0 None
  channels:
    /z : 0.0007332240373458809 to 5.8039471957616176 (0.0% NaN)
2 datas joined to create new data:
  axes:
    x : 76 points from 0.0 to 15.0 None
    y : 51 points from 0.0 to 10.0 None
  channels:
    /z : 0.0007332240373458809 to 6.0 (0.0% NaN)
2 datas joined to create new data:
  axes:
    x : 76 points from 0.0 to 15.0 None
    y : 51 points from 0.0 to 10.0 None
  channels:
    /z : 0.0007332240373458809 to 5.8039471957616176 (0.0% NaN)
import numpy as np
from matplotlib import pyplot as plt
import WrightTools as wt

a = wt.data.Data(name="a")
b = wt.data.Data(name="b")
a.create_variable("x", np.linspace(0, 10, 51)[:, None])
b.create_variable("x", np.linspace(5, 15, 51)[:, None])
a.create_variable("y", np.linspace(0, 10, 51)[None, :])
b.create_variable("y", np.linspace(0, 10, 51)[None, :])

a.create_channel("z", np.sin(a.x[:]) * np.cos(a.y[:]) + 1)
b.create_channel("z", 5 * np.exp(-((b.x[:] - 10) ** 2)) * np.exp(-((b.y[:] - 5) ** 2)) + 1)
a.transform("x", "y")
b.transform("x", "y")


first = wt.data.join([a, b], name="first")
last = wt.data.join([a, b], method="last", name="last")
min = wt.data.join([a, b], method="min", name="min")
max = wt.data.join([a, b], method="max", name="max")
mean = wt.data.join([a, b], method="mean", name="mean")

# Plot the splits in columns
fig, gs = wt.artists.create_figure(nrows=4, cols=[1, 1])
for i, da in enumerate([a, b, first, last, min, max, mean]):
    ax = plt.subplot(gs[i])
    ax.pcolor(da, vmin=0, vmax=6)
    wt.artists.corner_text(da.natural_name, ax=ax)
    ax.set_xlim(first.axes[0].min(), first.axes[0].max())
    ax.set_ylim(first.axes[1].min(), first.axes[1].max())

wt.artists.set_fig_labels(xlabel=a.axes[0].label, ylabel=a.axes[1].label)
Total running time of the script: ( 0 minutes 1.079 seconds)