Note
Click here to download the full example code
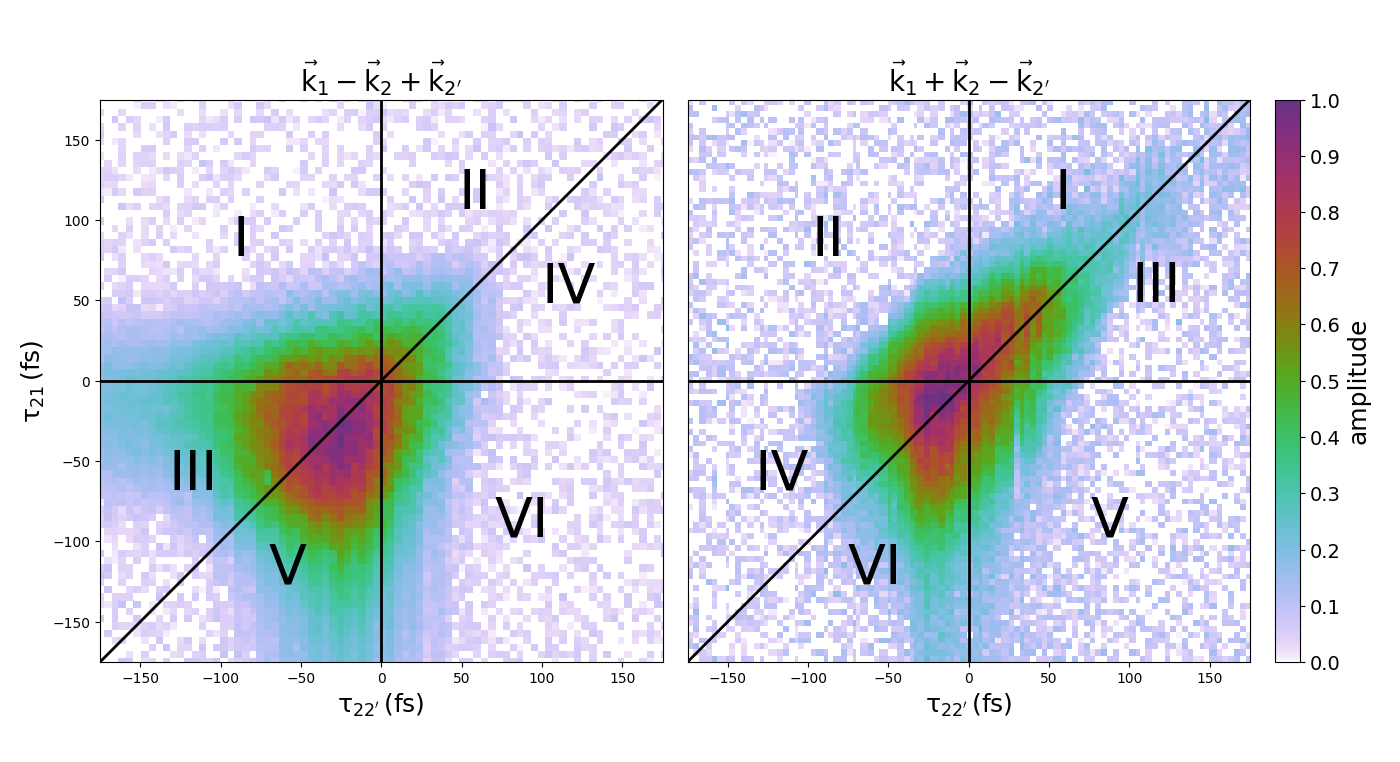
Label delay space
Using WrightTools to label delay space.
Out:
Correction factor applied to d1
Correction factor applied to d2
Correction factor applied to d1_points
Correction factor applied to d2_points
data created at /tmp/s2ns0lm_.wt5::/
  axes: ('d1', 'd2')
  shape: (101, 101)
axis d1 converted from ps to fs
axis d2 converted from ps to fs
Correction factor applied to d1
Correction factor applied to d2
Correction factor applied to d1_points
Correction factor applied to d2_points
data created at /tmp/0yqqebn9.wt5::/
  axes: ('d1', 'd2')
  shape: (101, 101)
axis d1 converted from ps to fs
axis d2 converted from ps to fs

<matplotlib.colorbar.Colorbar object at 0x7f6c3242e8b0>
import matplotlib.pyplot as plt

import WrightTools as wt
from WrightTools import datasets

fig, gs = wt.artists.create_figure(width="double", cols=[1, 1, "cbar"])


def set_lim(ax):
    ax.set_xlim(-175, 175)
    ax.set_ylim(-175, 175)


# traditional delay space
ax = plt.subplot(gs[0, 0])
p = datasets.PyCMDS.d1_d2_000
data = wt.data.from_PyCMDS(p)
data.convert("fs")
data.channels[0].symmetric_root(2)
data.channels[0].normalize()
data.channels[0].clip(min=0, replace="value")
ax.pcolor(data)
wt.diagrams.delay.label_sectors(ax=ax)  # using default labels
set_lim(ax)
ax.set_title(r"$\mathsf{\vec{k}_1 - \vec{k}_2 + \vec{k}_{2^\prime}}$", fontsize=20)

# conjugate delay space
ax = plt.subplot(gs[0, 1])
p = datasets.PyCMDS.d1_d2_001
data = wt.data.from_PyCMDS(p)
data.convert("fs")
data.channels[0].symmetric_root(2)
data.channels[0].normalize()
data.channels[0].clip(min=0, replace="value")
ax.pcolor(data)
labels = ["II", "I", "III", "V", "VI", "IV"]
wt.diagrams.delay.label_sectors(ax=ax, labels=labels)
set_lim(ax)
ax.set_title(r"$\mathsf{\vec{k}_1 + \vec{k}_2 - \vec{k}_{2^\prime}}$", fontsize=20)

# label
wt.artists.set_fig_labels(xlabel=data.d1.label, ylabel=data.d2.label)

# colorbar
cax = plt.subplot(gs[:, -1])
wt.artists.plot_colorbar(cax=cax, label="amplitude")
Total running time of the script: ( 0 minutes 1.558 seconds)