Note
Click here to download the full example code
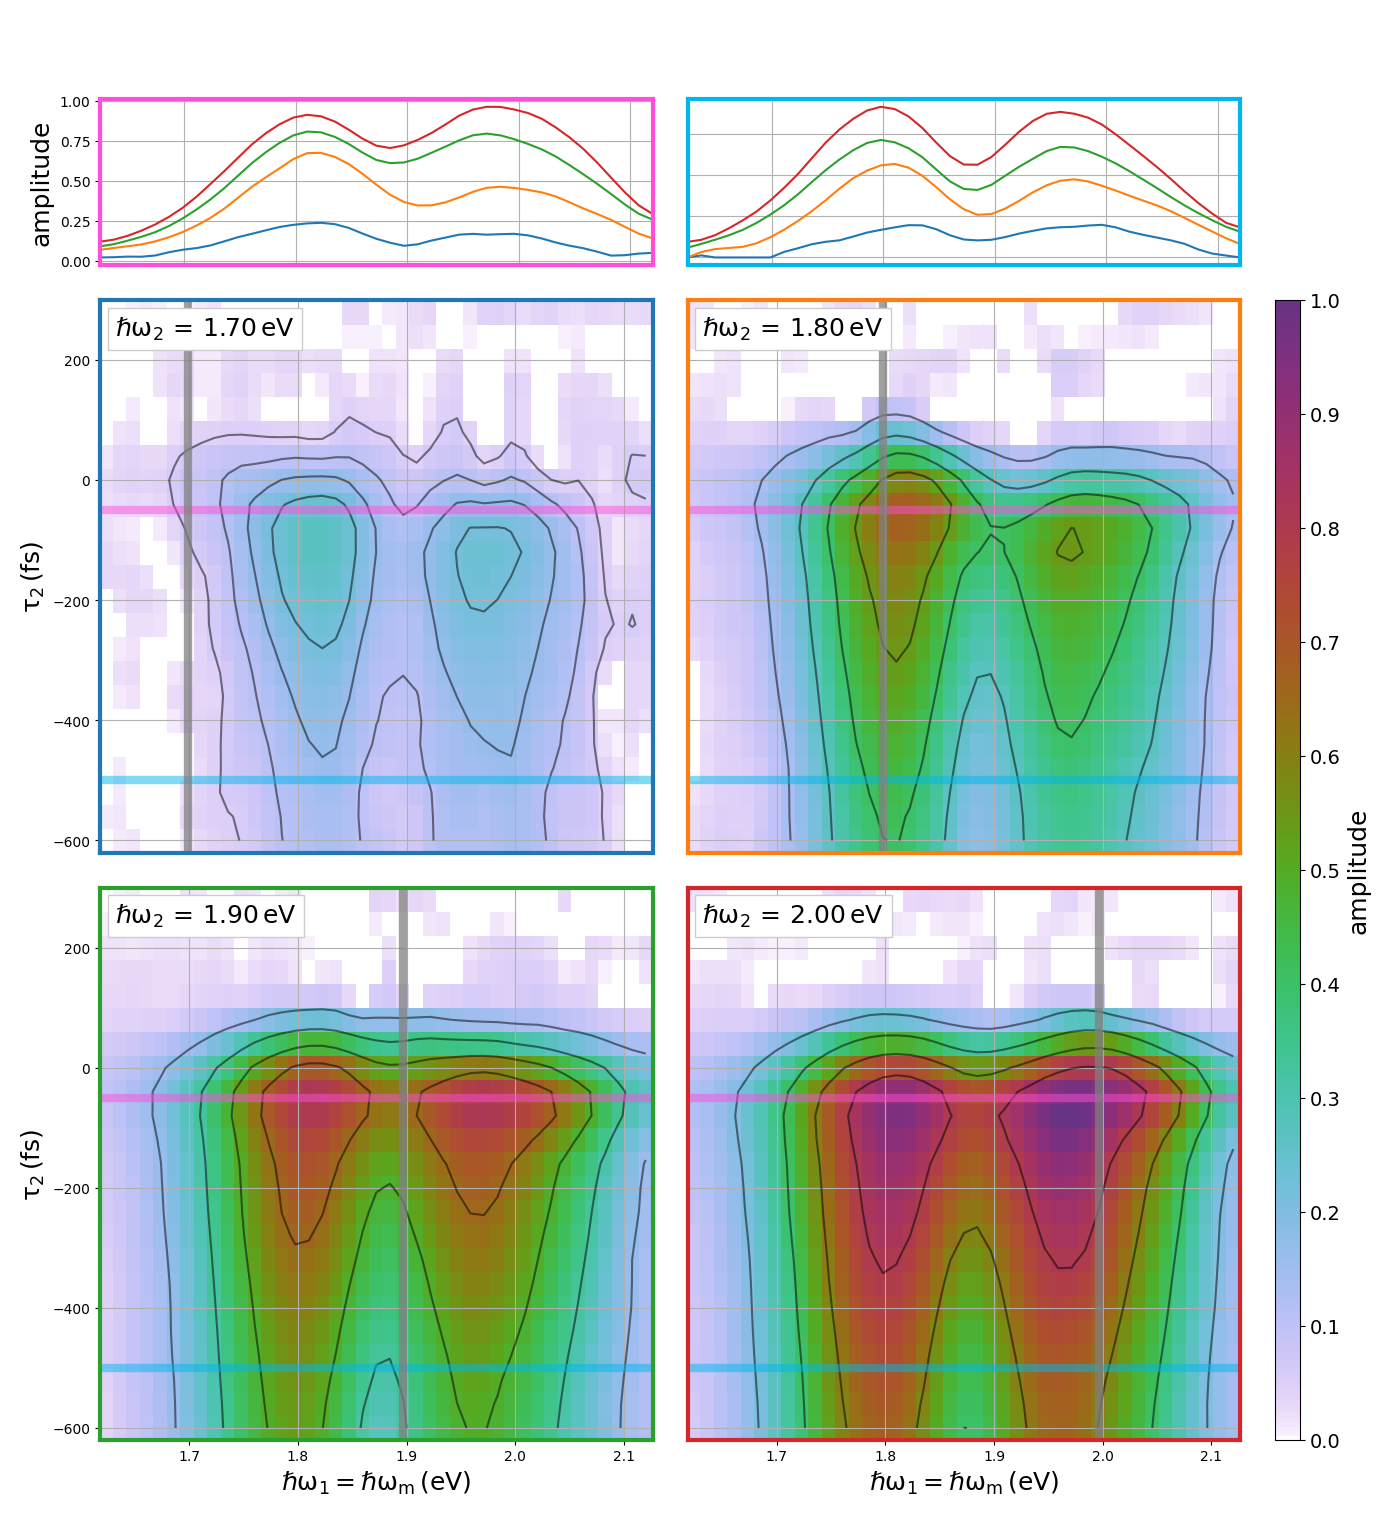
Custom Figure
Example of custom figure layout, beautification, and saving.
Out:
channel ai0 leveled along axis 2
smoothed data
chopped data into 1 piece(s) in ('w1=wm', 'd2')
chopped data into 1 piece(s) in ('w1=wm', 'd2')
chopped data into 1 piece(s) in ('w1=wm', 'd2')
chopped data into 1 piece(s) in ('w1=wm', 'd2')
chopped data into 1 piece(s) in ('w1=wm',)
chopped data into 1 piece(s) in ('w1=wm',)
chopped data into 1 piece(s) in ('w1=wm',)
chopped data into 1 piece(s) in ('w1=wm',)
chopped data into 1 piece(s) in ('w1=wm',)
chopped data into 1 piece(s) in ('w1=wm',)
chopped data into 1 piece(s) in ('w1=wm',)
chopped data into 1 piece(s) in ('w1=wm',)

'/home/docs/checkouts/readthedocs.org/user_builds/wrighttools/checkouts/latest/examples/custom_fig.png'
import matplotlib.pyplot as plt

import numpy as np

import WrightTools as wt
from WrightTools import datasets


# obtain and process data
p = datasets.wt5.v1p0p1_MoS2_TrEE_movie
data = wt.open(p)
data.level(0, 2, -3)
data.convert("eV", convert_variables=True, verbose=False)
data.smooth([2, 2, 2])
data.ai0.symmetric_root(2)
data.ai0.normalize()
data.ai0.clip(min=0, replace="value")
# chop out data of interest
d2_vals = [-50, -500]
w2_vals = [1.7, 1.8, 1.9, 2.0]
wigners = [data.chop("w1=wm", "d2", at={"w2": [w2, "eV"]})[0] for w2 in w2_vals]
traces1 = [
    data.chop("w1=wm", at={"w2": [w2, "eV"], "d2": [d2_vals[0], "fs"]})[0] for w2 in w2_vals
]
traces2 = [
    data.chop("w1=wm", at={"w2": [w2, "eV"], "d2": [d2_vals[1], "fs"]})[0] for w2 in w2_vals
]
tracess = [traces1, traces2]
# prepare spine colors
wigner_colors = ["C0", "C1", "C2", "C3"]
trace_colors = ["#FE4EDA", "#00B7EB"]
# prepare figure gridspec
cols = [1, 1, "cbar"]
aspects = [[[0, 0], 0.3]]
fig, gs = wt.artists.create_figure(
    width="double", cols=cols, nrows=3, aspects=aspects, wspace=0.35, hspace=0.35
)
# plot wigners
indxs = [(row, col) for row in range(1, 3) for col in range(2)]
for indx, wigner, color in zip(indxs, wigners, wigner_colors):
    ax = plt.subplot(gs[indx])
    ax.pcolor(wigner, vmin=0, vmax=1)  # global colormpa
    ax.contour(wigner)  # local contours
    ax.grid()
    wt.artists.set_ax_spines(ax=ax, c=color)
    # set title as value of w2
    wigner.constants[0].format_spec = ".2f"
    wigner.round_spec = -1
    wt.artists.corner_text(wigner.constants[0].label, ax=ax)
    # plot overlines
    for d2, t_color in zip(d2_vals, trace_colors):
        ax.axhline(d2, color=t_color, alpha=0.5, linewidth=6)
    # plot w2 placement
    ax.axvline(wigner.w2.points, color="grey", alpha=0.75, linewidth=6)
# plot traces
indxs = [(0, col) for col in range(2)]
for indx, color, traces in zip(indxs, trace_colors, tracess):
    ax = plt.subplot(gs[indx])
    for trace, w_color in zip(traces, wigner_colors):
        ax.plot(trace, color=w_color, linewidth=1.5)
    ax.grid()
    ax.set_xlim(trace.axes[0].min(), trace.axes[0].max())
    wt.artists.set_ax_spines(ax=ax, c=color)
# plot colormap
cax = plt.subplot(gs[1:3, -1])
ticks = np.linspace(data.ai0.min(), data.ai0.max(), 11)
wt.artists.plot_colorbar(cax=cax, label="amplitude", cmap="default", ticks=ticks)
# set axis labels
wt.artists.set_fig_labels(xlabel=data.w1__e__wm.label, ylabel=data.d2.label, col=slice(0, 1))
# ylabel of zeroth row
ax = plt.subplot(gs[0, 0])
ax.set_ylabel("amplitude")
# saving the figure as a png
wt.artists.savefig("custom_fig.png", fig=fig, close=False)
Total running time of the script: ( 0 minutes 4.075 seconds)