Note
Click here to download the full example code
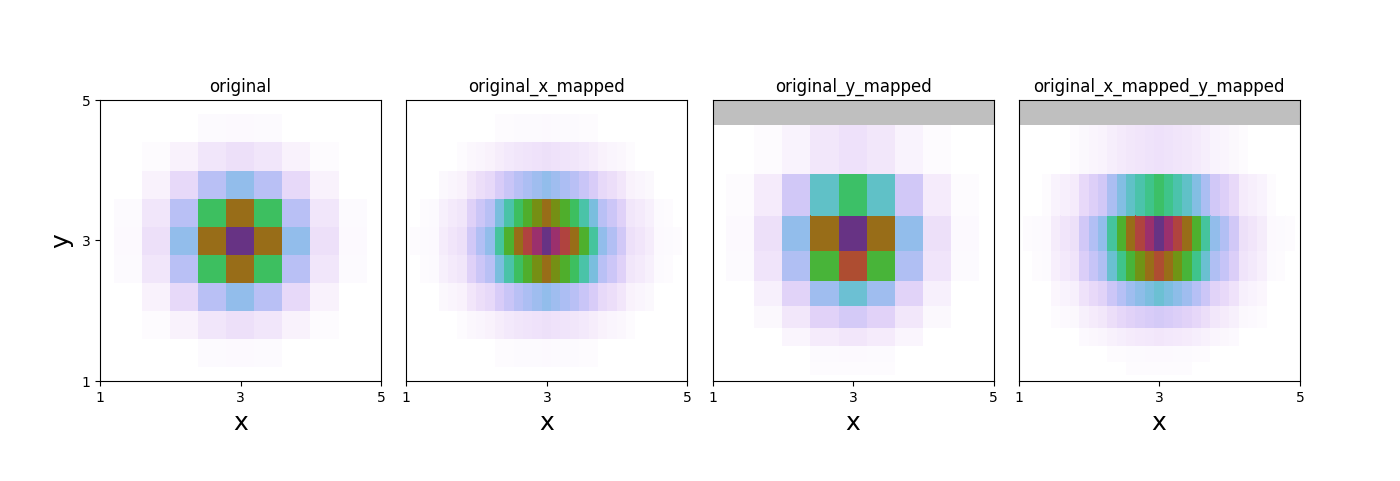
Map-Variable
An example of how map-variable works.
Out:
data mapped from (11, 11) to (31, 11)
data mapped from (11, 11) to (11, 11)
data mapped from (31, 11) to (31, 11)
import numpy as np
from matplotlib import pyplot as plt
import WrightTools as wt

# create original arrays
x = np.linspace(1, 5, 11)[:, None]
y = np.linspace(1, 5, 11)[None, :]
arr = np.exp(-1 * (((x - 3) / 0.6) ** 2 + ((y - 3) / 0.6) ** 2))
# create data object
d = wt.data.Data(name="original")
d.create_variable("x", values=x)
d.create_variable("y", values=y)
d.create_channel("z", arr)
d.transform("x", "y")
# create new data objects
pointsx = np.linspace(x.min(), x.max(), 31)  # linear spacing
pointsy = points = np.logspace(0, 0.7, 11)  # log spacing
dx = d.map_variable("x", points=pointsx)  # just linear along x
dy = d.map_variable("y", points=pointsy)  # just log along y
dxy = dx.map_variable("y", points=pointsy)  # linear along x and log along y
ds = [d, dx, dy, dxy]
# create figure
fig, gs = wt.artists.create_figure(width="double", cols=[1, 1, 1, 1])
for i, d in enumerate(ds):
    ax = plt.subplot(gs[i])
    ax.pcolor(d)
    ax.set_title(d.natural_name)
    ax.set_xlim(1, 5)
    ax.set_ylim(1, 5)
ticks = [1, 3, 5]
wt.artists.set_fig_labels(
    xlabel=d.axes[0].label, ylabel=d.axes[1].label, xticks=ticks, yticks=ticks
)
Total running time of the script: ( 0 minutes 0.367 seconds)